ChartLlama: A Multimodal LLM for Chart Understanding and Generation

1Nanyang Technological University 2Tencent 3Southeast University
(* Equal contributions, ✦ Corresponding Author)
Interpolate start reference image.
Capability demonstration of ChartLlama. An instruction-tuning dataset is created based on our proposed data generation pipeline. We train ChartLlama on this dataset and achieve the abilities shown in the figure.
Interpolate start reference image.
Pipeline of our data generation method. The innovative data generation process we proposed consists of three important steps relying on GPT-4. The dataset generated using this process exhibits significant advantages compared to previous datasets in terms of data diversity, quality, the number of chart types, and the variety of tasks. ChartLlama, which is trained on this dataset, has the ability to perform various tasks based on the design of the instruction-tuning data.
Interpolate start reference image.
Distributions of different types of data in our dataset. The top and bottom pie charts show the distribution of task types and chart types, respectively. The illustration is generated by our proposed ChartLlama.

Abstract

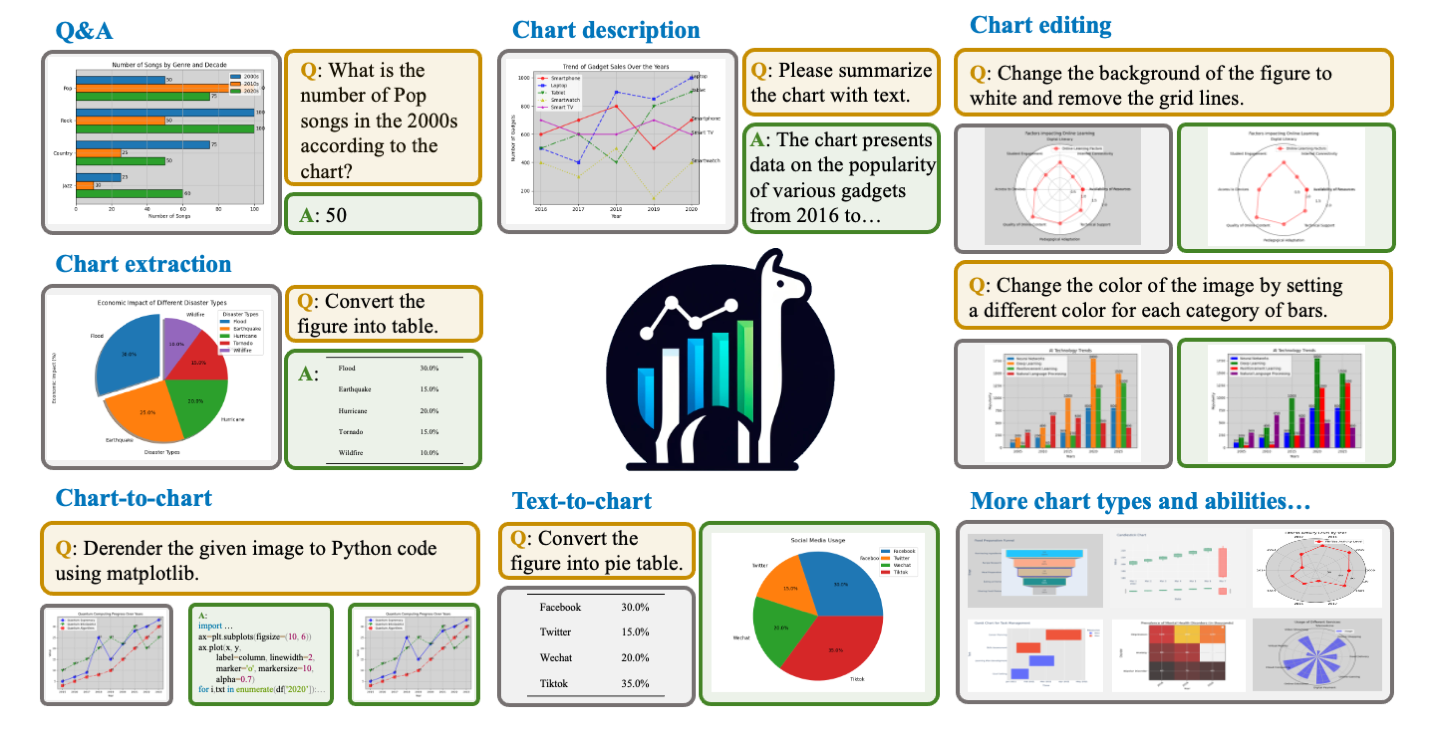
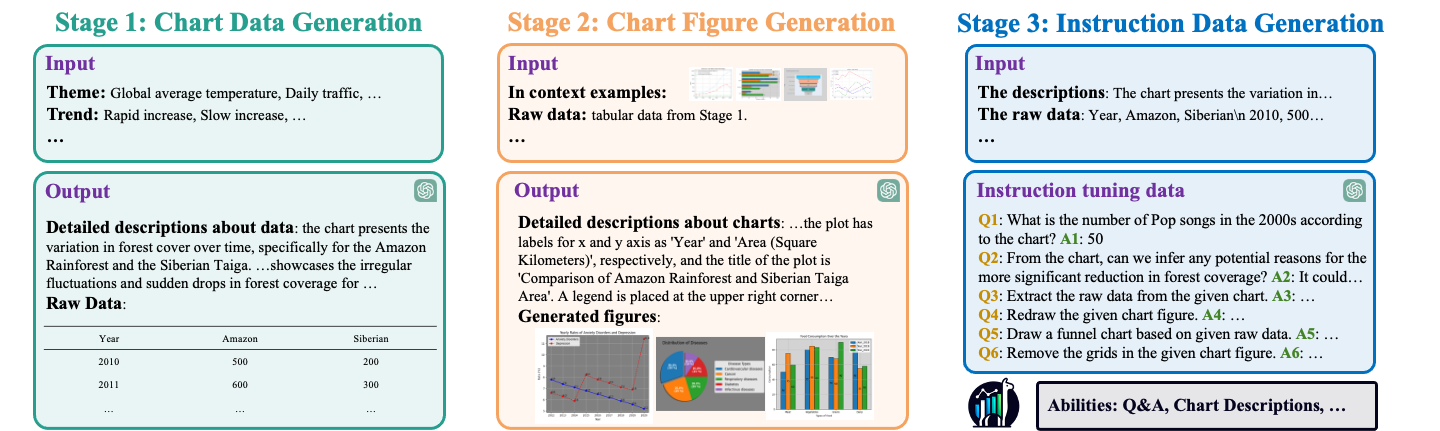
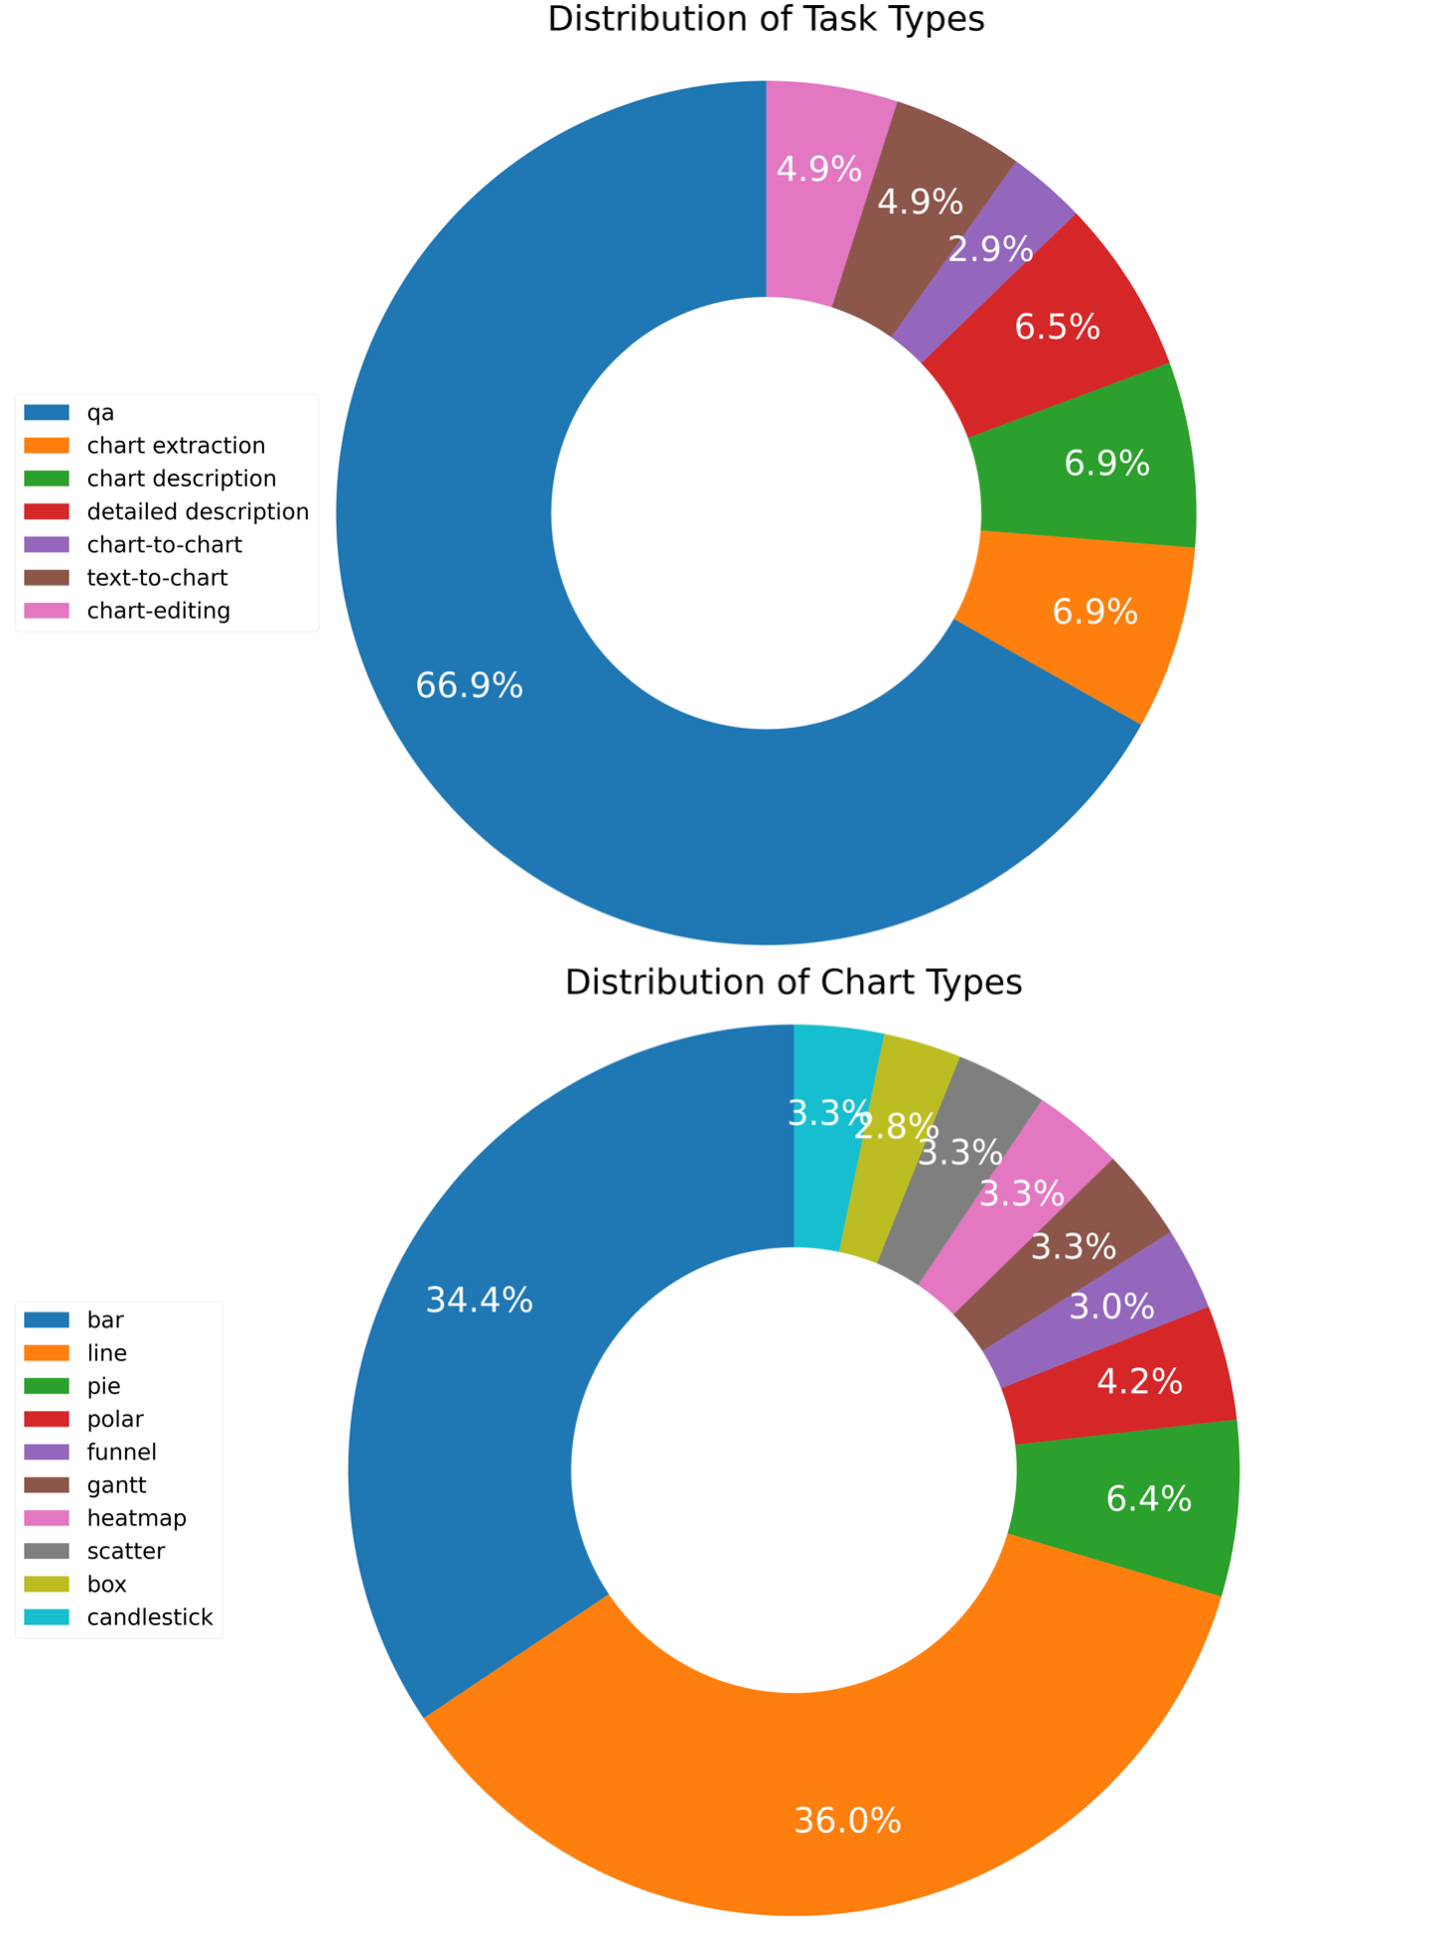
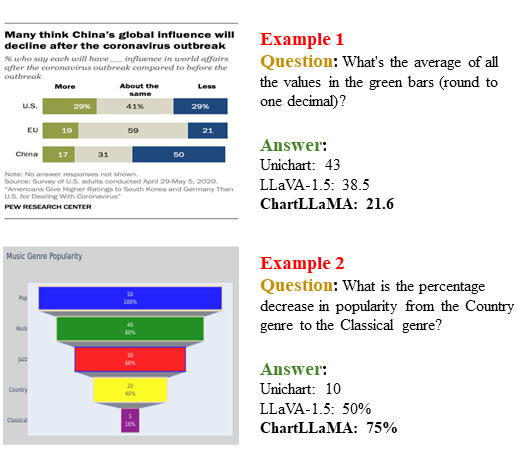
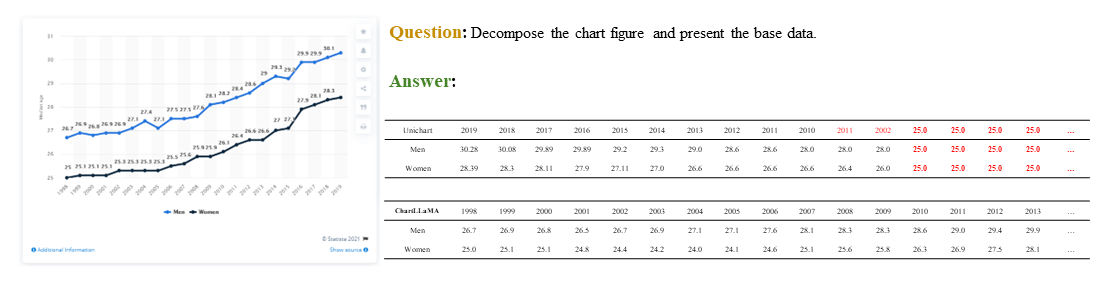
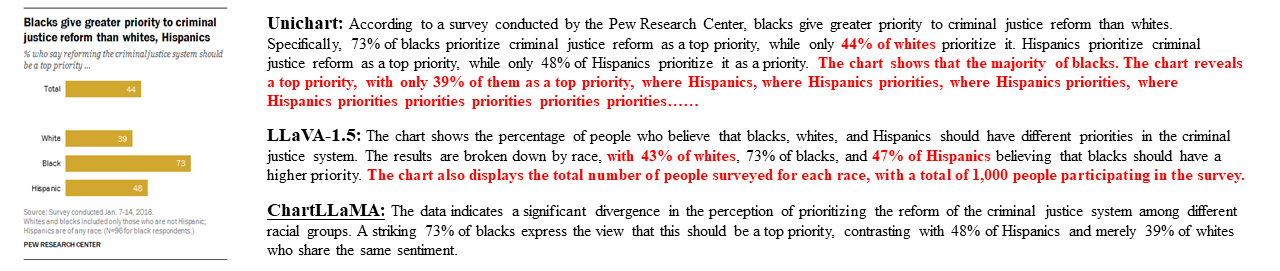
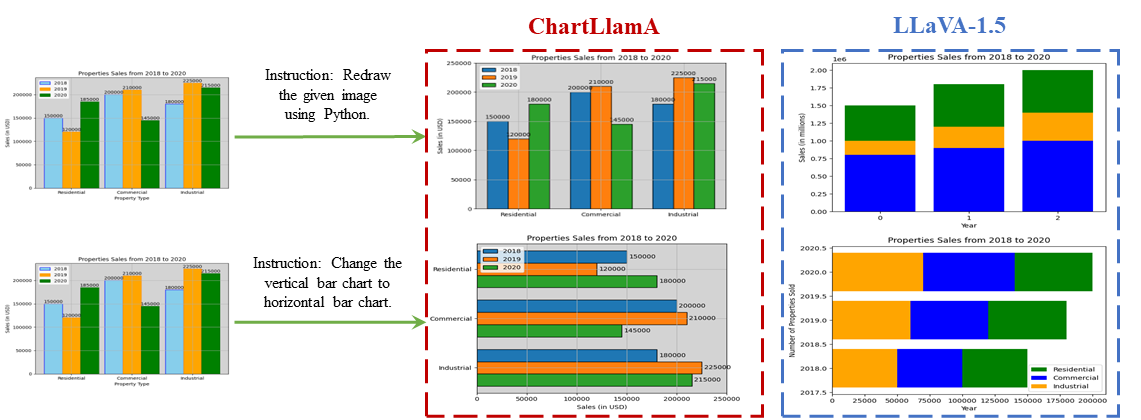
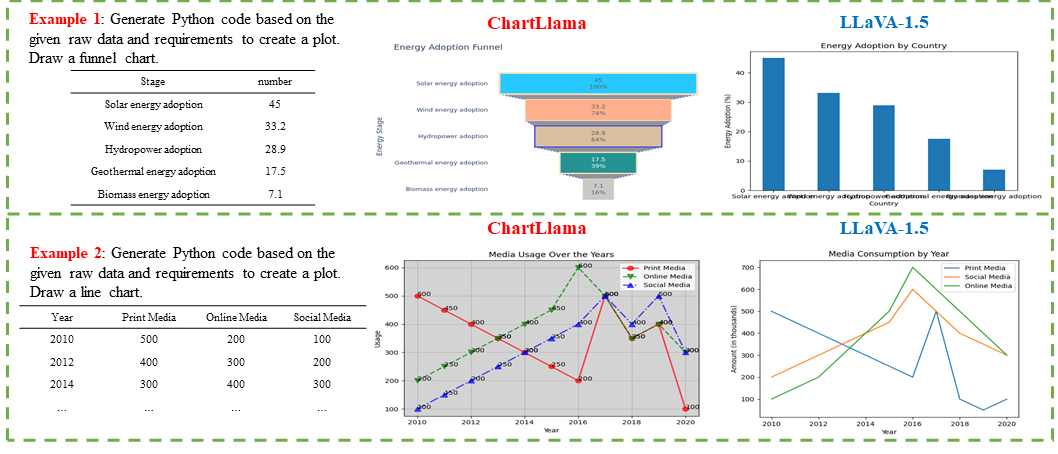
Multi-modal large language models have demonstrated impressive performances on most vision-language tasks. However, the model generally lacks the understanding capabilities for specific domain data, particularly when it comes to interpreting chart figures. This is mainly due to the lack of relevant multi-modal instruction tuning datasets. In this article, we create a high-quality instruction-tuning dataset leveraging GPT-4. We develop a multi-step data generation process in which different steps are responsible for generating tabular data, creating chart figures, and designing instruction tuning data separately. Our method's flexibility enables us to generate diverse, high-quality instruction-tuning data consistently and efficiently while maintaining a low resource expenditure. Additionally, it allows us to incorporate a wider variety of chart and task types not yet featured in existing datasets. Next, we introduce ChartLlama, a multi-modal large language model that we've trained using our created dataset. ChartLlama outperforms all prior methods in ChartQA, Chart-to-text, and Chart-extraction evaluation benchmarks. Additionally, ChartLlama significantly improves upon the baseline in our specially compiled chart dataset, which includes new chart and task types. The results of ChartLlama confirm the value and huge potential of our proposed data generation method in enhancing chart comprehension.

Interpolate start reference image.
Visualization on the ChartQA task. Here are two examples of the predictions of Unichart, LLaVA-1.5, and ChartL- lama. Our proposed ChartLlama could follow the long instructions and do calculations to get the correct results.
Interpolate start reference image.
Visualization of Chart-extraction. We find that ChartLlama is especially good at long text processing. While the previous SOTA, Unichart, will generate meaningless redundant words when the output is too long.
Interpolate start reference image.
Visualization of Chart-to-text. We select one image from the Pew Dataset and show the results of Unichart, LLaVA-1.5, and ChartLlama. We find that Unichart easily falls into repeated words again and LLaVA-1.5 suffers from hallucination.
Interpolate start reference image.
Qualitative comparison for Chart-to-chart and Chart editing tasks. We present the output results of LLaVA-1.5 and ChartL- LaMA for the same chart given different instructions. The instruction in the first row requires the model to output the original chart, performing the chart-to-chart task. The instruction in the second row requires the model to output a horizontal bar chart, performing the chart editing task.
Interpolate start reference image.
Qualitative comparison for Text-to-chart task. We have presented the generated images by ChartLLaMA and LLaVA-1.5 given the tabular data and the specified requirements.
Interpolate start reference image.
We achieve SOTA on traditional tasks. Traditional tasks include ChartQA, Chart-to-text and Chart extraction.
Interpolate start reference image.
We achieve SOTA on new tasks. We propose several new tasks based on our proposed data generation mechanism.

BibTeX


@misc{han2023chartllama,
  title={ChartLlama: A Multimodal LLM for Chart Understanding and Generation}, 
  author={Yucheng Han and Chi Zhang and Xin Chen and Xu Yang and Zhibin Wang and Gang Yu and Bin Fu and Hanwang Zhang},
  year={2023},
  eprint={2311.16483},
  archivePrefix={arXiv},
  primaryClass={cs.CV}
}